
Waffle recipes are quite simple and do not need many ingredients. To obtain the adequate waffle sheet structure, the flour used should meet certain characteristics when it comes to protein and gluten content.
Waffles are flat fine bakery products, which are baked between two hot iron plates (waffle iron) or within a specific waffle machine. There exist many different varieties of this baked good, which are different in structure and texture, e.g. flat, soft or cross waffles.
Flat waffles are a dry pastry with a porous structure, made so mainly due to evaporating water. Waffles are used for different purposes (rolled or casted ice-cream cones), in layers incorporated in sweets (flat waffle, waffle sticks) or also as waffle sheathing for a chocolate filling (hollow waffle).
Waffle recipes are quite simple and do not need many ingredients, whereas besides water, flour is the main component. Also milk, sugar, salt, baking improver and/or fat may be added. Most waffle-masses are fluid and pumpable. The flour used should be weak, with low protein and wet gluten content, in order to obtain a complete structure of the waffle sheet. The water absorption rate of waffle flours should be low, so that a small water addition can achieve a dough that can be easily pumped, which allows for a wide application of water as baking agent (water steam proving).
For industrial production, the waffle mass is pumped through a tubing system. In this process, mechanical energy is imposed into the mass, which leads to a viscosity change if gluten protein is present. The so-called gluten aggregation can influence dosing and thus leads to waffle forms not filling properly, or to unwanted side effects such as cracks in the baked product. It is also possible that clots are formed, which lead to a blockage of the dosing dies.
A quick and reliable method for characterizing the most main flour parameters (wet gluten, protein content, and water absorption) is of great importance for the producers of waffle products. The evaluation of flours with a Brabender GlutoPeak, and the GlutoPeak evaluation ”Rapid Flour Check” provide such a method, which implements a quick characterization of flours by mixing a small quantity of flour and water within a controlled environment, to analyze and monitor the gluten development within that dough. As a newer development, the “Low Protein Check” (LPC)-method, which is specifically designed for properties of low protein flours, can now also be employed.
For the project analyzed, these GlutoPeak methods were tested, implementing 20 different flour samples. The aim of this test was to check, if these methods give reliable results and offer the same possibilities to obtain information in regard to mixing and baking waffle products within a short time range, in comparison to standard routine analysis. The flour samples where provided by mills and food manufacturers. Bühler AG from Uzwil, Switzerland and Brabender GmbH & Co. KG, Duisburg, Germany, partnered for this project. The baking tests, the planning, realization, and evaluation where carried out at the Bühler/Haas food technical center in Leobendorf (Austria). A GlutoPeak instrument was also utilized, provided by Brabender.
1. Material and methods
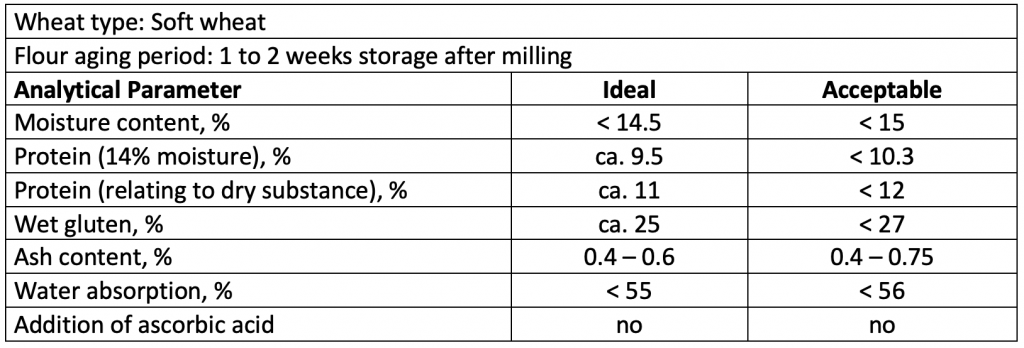
For the project work, 20 different wheat flours were used, typical waffle flours or cookie flours. As a baking test, standard ice cones were produced. All flour samples were tested with the GlutoPeak and standard laboratory analyses (followning ICC) prior to the waffle dough preparation and then baked into ice cones. With the exception of one sample, all other samples fulfilled the basic requirements of a waffle dough (pls. see table 1).
Table 1: Analytical Parameter for Waffle Flour
1.1 Laboratory analysis using the Brabender GlutoPeak
The first analysis was carried out with the GlutoPeak (pic. 1) following the ‘Rapid Flour Check’ standard method and the available evaluation algorithm.
After defining the moisture content of the flour sample, approx. 9 g of water (depending on the water content of the corresponding sample) was filled into the measuring bowl and inserted into the GlutoPeak. By using a connected thermostat, the measuring opening in the housing was heated up to 36°C, for consistent test conditions, i.e. homogenous temperature distribution in the measuring bowl. After two minutes, when the temperature was evenly distributed within the water-filled measuring bowl, the corresponding flour quantity (depending on the water content of the specific flour) was added.
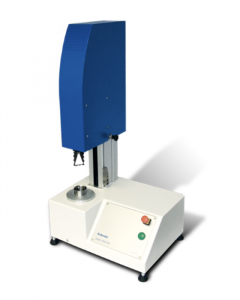
Pic. 1: Brabender GlutoPeak
By pressing down the measuring head, which has the measuring paddle mounted at its lower side, the GlutoPeak is closed and the test starts automatically. Before the test, the corresponding test parameters were stored into the MetaBridge instrument software. The motor, built-in the measuring head, drives the paddle and thus generates the rotation.
Depending on the flour property, the measurement takes 2 – 5 minutes at 2750 min-1. Due to the high energy input, a gluten network develops, corresponding to the quality and quantity of each type of gluten, showing a peak as the highest value (torque). Afterwards, the network is destroyed due to the mechanical energy input, the curve declines and the measurement ends. A typical curve diagram is depicted in pic. 2.
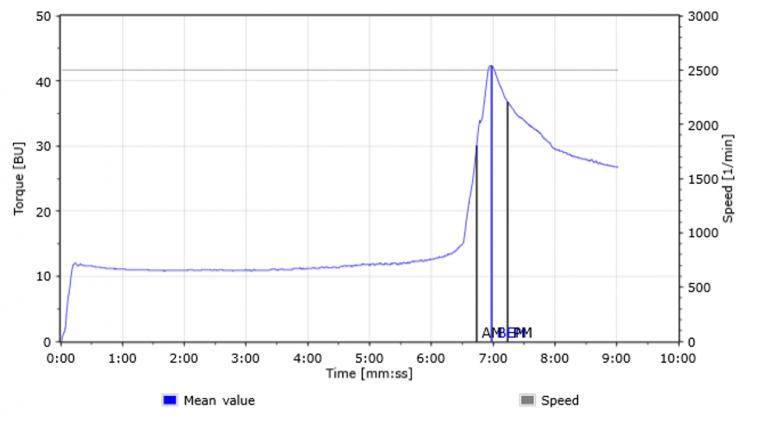
Pic. 2: GlutoPeak diagram of a waffle flour
After the test ends, the highest torque is listed as peak (BEM/max. torque), and the necessary time (PMT/Peak Maximum Time) is evaluated. Additional measuring points are the torque every 15 seconds before and after the maximum (AM/PM). Up to eight measurements per hour were possible, thanks to this rapid test procedure and the machine’s fast cleaning capability.
The Rapid Flour Check analysis also provides for correlations towards other measuring procedures. These are protein content, wet protein content, water absorption, and the W-value (Alveograph process), whereby the latter mentioned was not considered.
After a short cleaning, the next measurement was done. Due to the rapid test procedure and easy cleaning, up to eight measurements per hour were possible.
The ‘Low Protein Check’ (LPC) method, which was developed during the project, was used in a second step. Hereby approximately 12 g of water per 11 g flour (depending on the water content of each flour) are weighed. This method is done with a reduced speed of 2,500 min-1 and a temperature of 180°C. The earlier mentioned evaluation is not changed by using this method. All tests were carried out as triple measurements and the results were collected and evaluated with the integrated software (MetaBridge).
1.2 Laboratory Analysis according to ICC-Standard Methods
Most flour samples available were provided with the appropriate specifications. In most cases, these contained an average range within which the corresponding flour parameter should result. However, in some cases, it was not detectable if standard analysis methods were applied for testing.
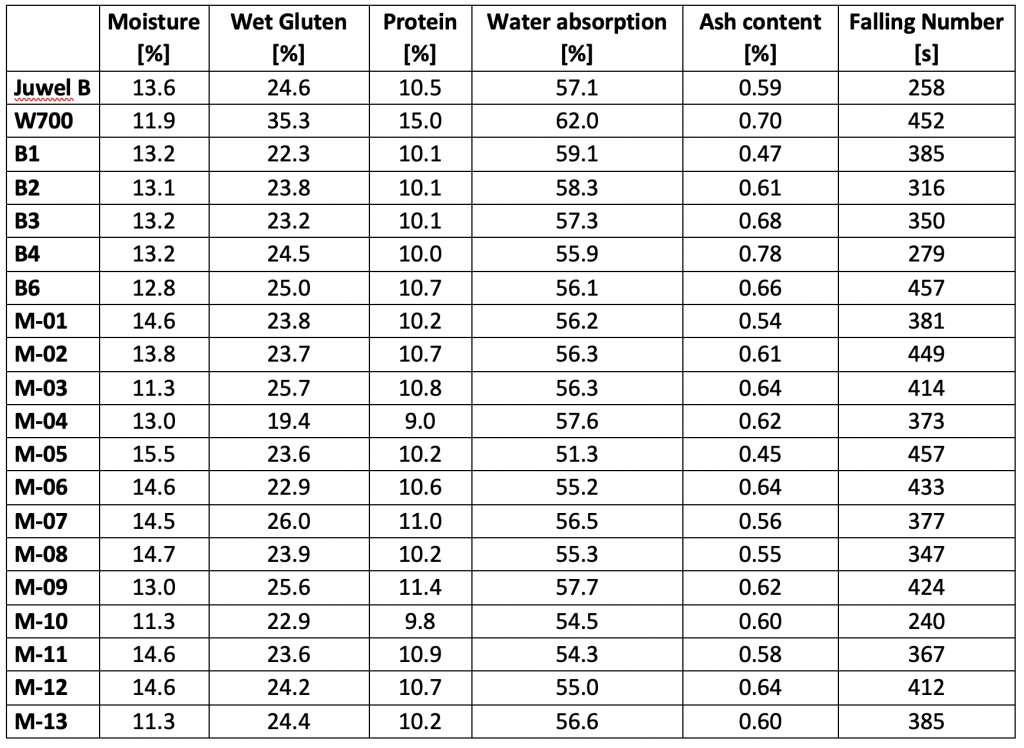
In order to get reliable information about the available samples, all samples were checked by an accredited laboratory in Austria in compliance with the standard ICC methods.
All results of the flour analysis in accordance with ICC-Methods are specified in table 2.
Table 2: Measured flour parameters according to ICC-Method
1.3 Producing a waffle dough
The recipe used for making the waffle mass is depicted in table 3. In fixed order, water and sodium bicarbonate were given into an IKA laboratory stirrer equipped with a R1300 blade mixer, and mixed at moderate speed until a complete homogenization was reached.
Table 3: Recipe for Making a Waffle Dough
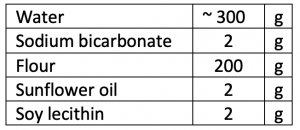
Following the next process steps, flour was inserted and the mixer speed was increased. After adding all the flour, the waffle mass was mixed again until again complete homogenization was reached. In the next step, the pre-prepared 1:1 mixture of sunflower oil and soy lecithin was added into the mass und mixed for an additional 60 seconds.
Immediately after mixing, the viscosity was measured using a gravity feed cup of 100 ml and an 8 mm-diameter die (according to ASTM D 333). In case that the measured viscosity showed a deviation from the defined viscosity, the water amount of the recipe was adjusted and a new waffle mass was prepared.
By adjusting the viscosity of each dough to 20 seconds (+/- 1 sec.) the mechanical behavior during baking can be considered similar for all flours, assuming that the product properties can only depend on the flour property itself. The necessary water/flour-relation is an important parameter for developing a specific viscosity and is recorded for all test masses.
1.4 Baking waffles (casted cones)
Cones were baked with an electrical heated laboratory instrument type LB-SWAK_STAK, equipped with an industrial baking pan and a corresponding core plate (pic. 3).
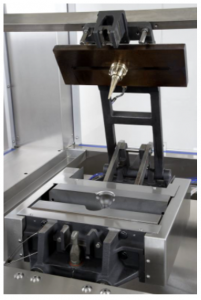
Pic. 3: Typical carrier for industrial ‘Waffle-Cone-Baking Oven’ as laboratory instrument
The pan was heated up to 180°C, whereas the cores were heated up to 190°C. Using a spraying device, a 7 ml waffle mass was inserted and the baking time was 80 seconds. Prior to closing the carrier for the final baking process, it was closed and opened twice (so-called breathing: 2 sec. open, 2 sec. closed) in order to let steam evaporate out of the system.
After baking, the cones were removed from the open baking pan and left to cool at room temperature for approximately 10 minutes. The cooled cones were packed in PE wrapping, hot sealed, and stored at 8°C until the texture analysis took place.
1.5 Waffle texture analysis
The texture analysis was carried out with a TA.XT.plus Texture Analyser (Stable Micro System) using an ice cream cone pan (A/ICC). This tool measures the force necessary to create a crackby pressing a ball-like item of a certain diameter and weight against the cone.
The most important texture parameters are the distance the ball moves, as well as the force that is necessary to break the cone. To carry out the texture analysis for every flour, 10 cones were tested. The obtained results are summarized and evaluated below.
2. Results and discussion
2.1 GlutoPeak ‘Rapid Flour Check’ vs. standard analysis
The GlutoPeak method ‘Rapid Flour Check’ was developed for flours destined for baked goods, which require medium to high gluten levels. Although flours for waffle production do not require high standards concerning their protein content, the method should be verified for its applicability.
Comparing the results of the ‘Rapid Flour Check’ with the results obtained with the standard analysis, in principle, the correlation of all relevant parameters (protein content, wet gluten, and water absorption) were good (pic. 4 – 6), however they were showing relatively high deviations.
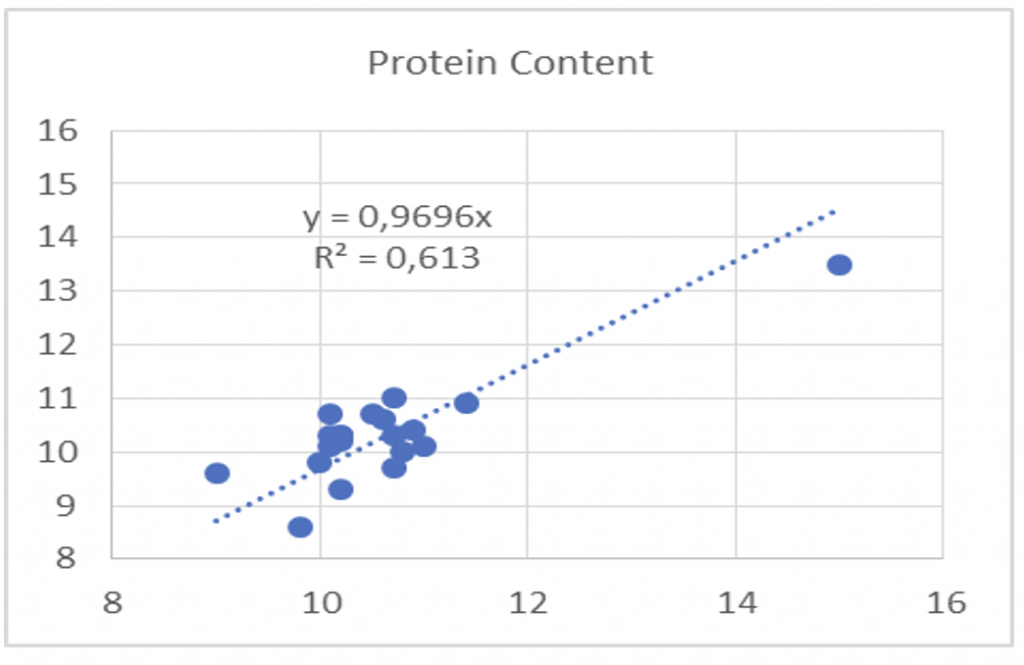
Pic. 4: Correlation of protein content measured with GlutoPeak „Rapid Flour Check“ and routine analysis
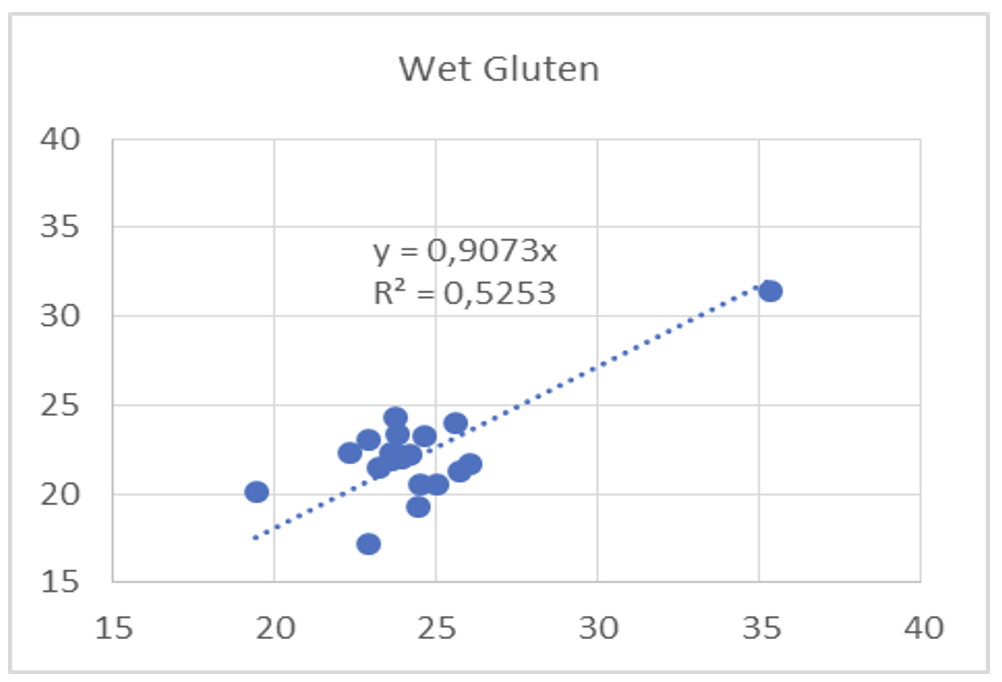
Pic. 5: Correlation of wet gluten measured with GlutoPeak „Rapid Flour Check“ and routine analysis
Brabender states that the correlated protein content varied by +/- 0.8 within a range of 10.5 to 15 %. Testing the flour samples, similar results are obtained (apart from W700 having a high protein content). The wet gluten numbers should range within +/- 2.3 in comparison to the standard analysis, which was nearly reached for the flour samples tested.
In both cases the GlutoPeak method underestimated the results of the standard measurements, and was somewhat lower in protein content, by around 3.5 %, and 11 % for the wet gluten content.
The GlutoPeak method, however, overestimated the water absorption by around 2% (see pic. 6). Brabender specified a deviation in water absorption of +/- 2.8, which the Bühler results confirm closely. It is clearly recognizable that the deviation is increasing with lower WA values (waffle flour of a WA < 55%). This is a disadvantage of the ‘Rapid Flour Check’ method, as it is designed for flours with higher protein quantities and water absorption.
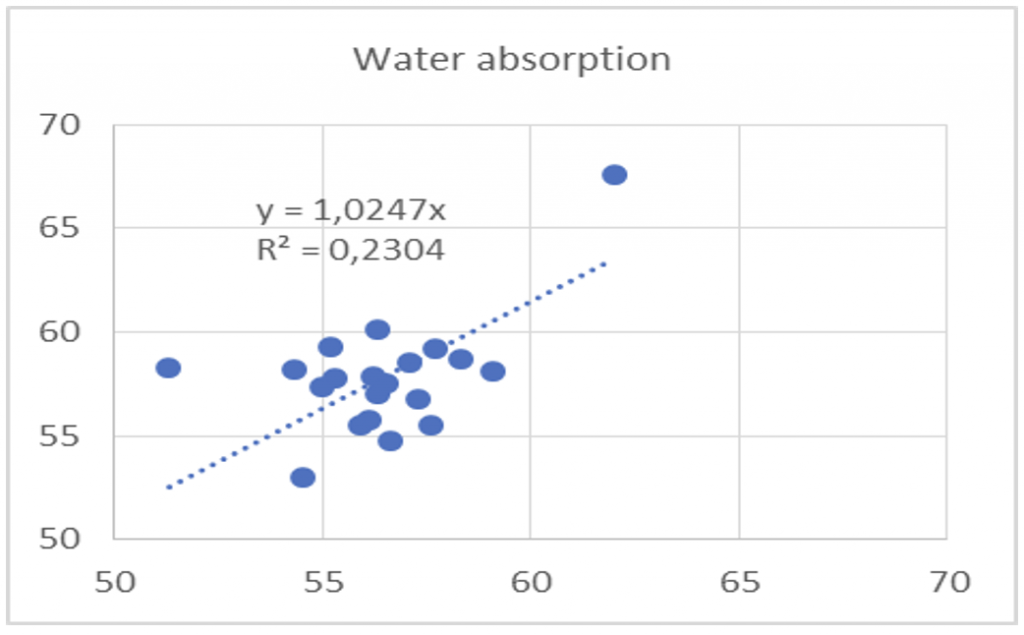
Abb. 6: Correlation of water absorption measured with GlutoPeak ‘Rapid Flour Check’ and routine analysis
To maximize the potential of the GlutoPeak results and optimize their relevance for waffle flours, Brabender included the newly developed ‘Low-Protein’ method in the course of the test series. The already-obtained data was re-evaluated and then compared with the results of the ICC method. The results obtained showed a good correlation between both methods, which is commented later in the course of this study.
2.2 Parameters for mixing and baking waffle masses adapted to Basic GlutoPeak Data
To verify a correlation between required water quantities – respectively, the product weight and flour parameters – the data of the standard analysis and the GlutoPeak analysis are dealt with separately. Primarily, a correlation of standard laboratory data is shown here. Following, it is tested for whether a correlation with standard laboratory data is also observed for the GlutoPeak data.
Correlations and results of the ‘Low-Protein’ method are listed in separately.
2.2.1 Standard analysis
The basic correlation of the required water amount (for a determined dough viscosity) and the flour’s water absorption is well known for waffle production and can also be illustrated for similar flours (see pic. 6). Flours with a higher water absorption need more water for reaching a defined dough viscosity. This can be a disadvantage during waffle baking, as the baked waffle normally has a water content of 1 – 2%. Therefore, the water included in the waffle mass has to evaporate during baking, when it acts as a leavening agent, thus leading to very brittle or even incomplete products (inaccurate distribution of the mass within the baking pan).
A water reduction, however, is not always possible when those flours are involved, as the resulting increase in viscosity impacts the dough and product properties negatively. A decisive factor is the water demand of the flour.
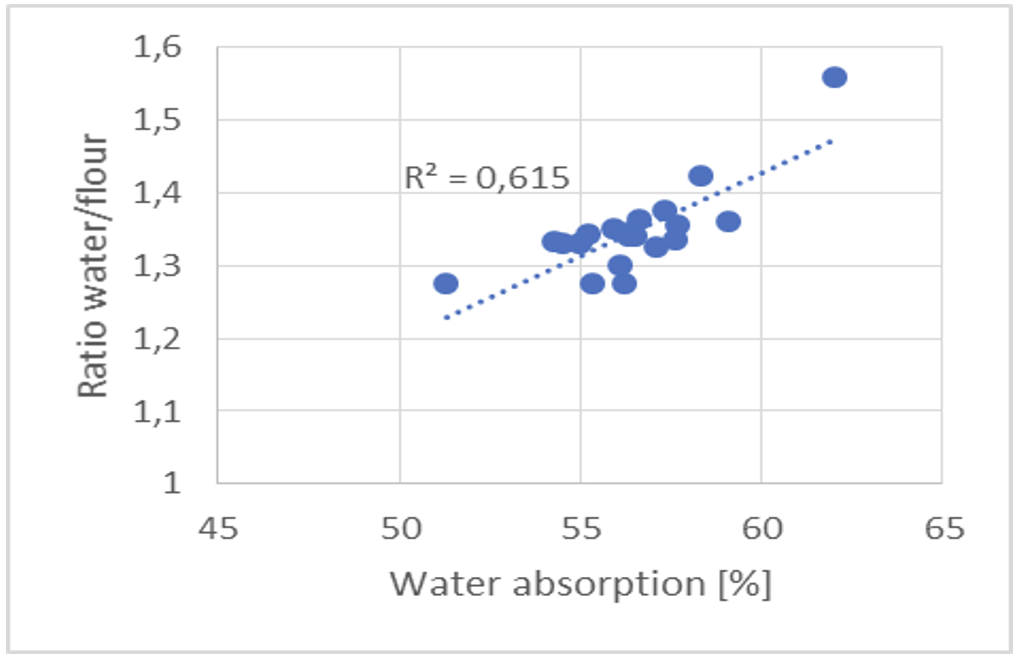
Pic. 7: Water demand of the dough in correlation with the water absorption
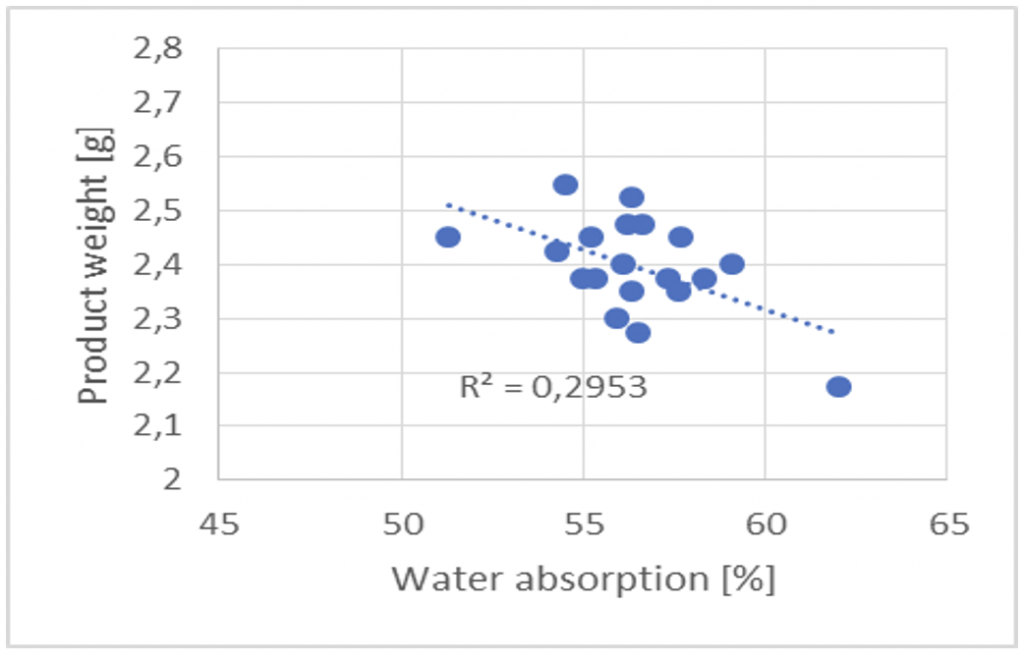
Pic. 8: Waffle weight in correlation with the water absorption
An easy-detectable effect concerning the water requirements is the product density and the resulting weight. The higher the water amount, respectively the water demand, the lower the density of the waffle product (i.e. product weight). A high water absorption leads to products with a low density, as qualitatively depicted in pic. 8. Besides the flour properties, parameters such as the baking temperature (especially the core temperature can strongly vary during batch baking), the dosing volume will influence the final result and the density of waffle products.
Considering these additional influencing factors during baking, it suggests that the correlation of the product weight with the water absorption is less significant than the correlation with the water demand in dough preparation.
More importantly, this impacts batch baking of waffle sheets on a laboratory scale, where significant differences in regards to waffle density may occur.
2.2.2 GlutoPeak data
A good correlation of the water absorption is obtained with the ‘Rapid Flour Check’ Gluto-Peak method and the water demand results in less significant values in comparison with standard analysis (see pic. 9).
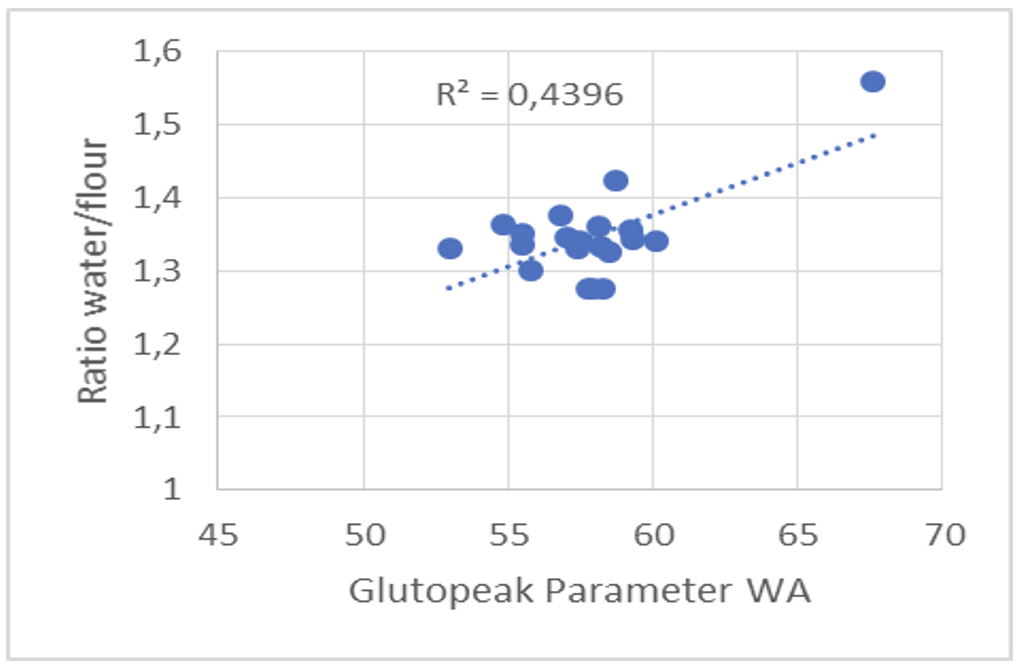
Pic. 9: Water demand of the dough correlating to the water absorption GlutoPeak
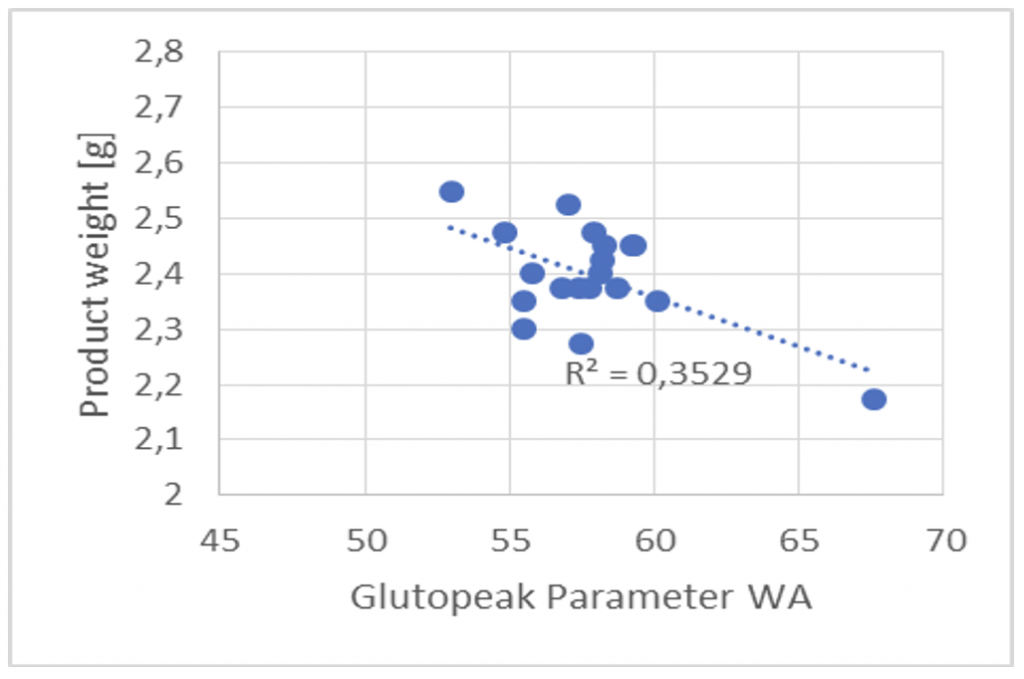
Pic. 10: Waffle weight correlating to the water absorption GlutoPeak
Sample W700 (very high protein and wet gluten content) is clearly identifiable within the sample points. If only the waffle flours are considered, no clear trend is visible. The same applies to the product density (Pic. 10). Therefore, the GlutoPeak parameter WA is less significant compared to the water absorption, measured by standard analysis.
A better correlation is achieved, when the parameter G (wet gluten content) is selected instead of the parameter WA (Pic. 11 and 12).
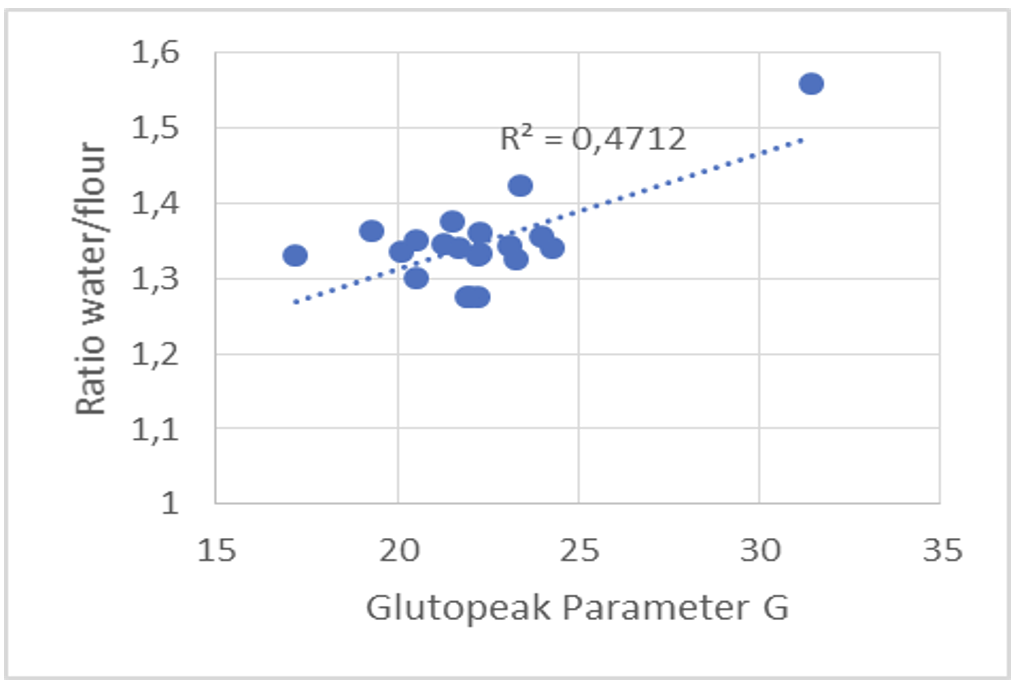
Pic. 11: Water demand correlating to GlutoPeak Parameter G
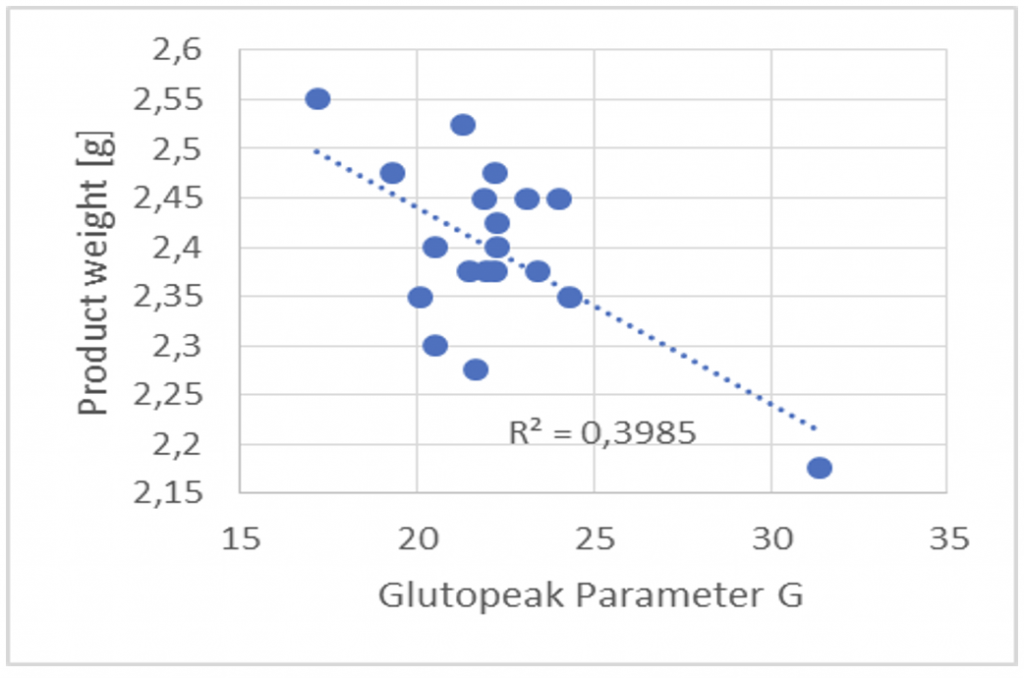
Pic. 12: Waffle weight correlating to GlutoPeak Parameter G
2.3 Predicting product properties based on GlutoPeak data
Predicting waffle properties from flour data is difficult, as not only the dough influences the product, but also the temperature, temperature deviations in the oven, as well as dosing (quantity, speed). The data acquired from the texture analysis of the waffle product already exhibits a significant static variance and does not correlate well with the flour properties.
Considering the test setup (see Pic. 13), the essential properties concerning product stability are the distance the ball is pressed into the cone (until the first crack appears), as well as the corresponding force maximum for that crack.
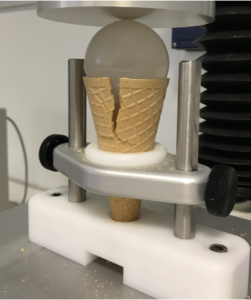
Pic. 13: Texture analysis set-up
Both parameters are severely influenced by the waffle structure near the steam vent of the baking pan. Flours with low water absorption show generally also at that point homogenous, dense structures (see pic. 14).
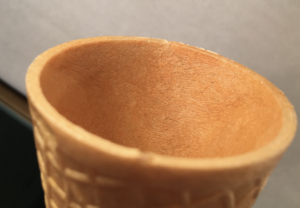
Pic. 14: Waffle rim (steam vent zone) flour B1
Stronger doughs tend to withstand the steam flow, if they have higher water absorption properties, and present streamline structures close to the steam vents (pic. 15). The stronger the flour, the more intensive these structures are, which lead to areas with less density and corresponding lower stability.

Pic. 15: Steam flow vent flour M04 (left) / Steam flow vent flour W700 (right)
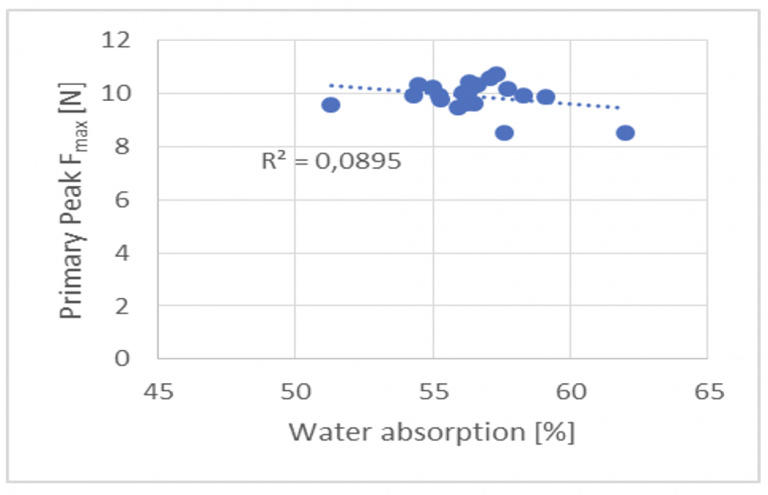
Abb. 16: Correlation of force maximum Peak 1 and water absorption
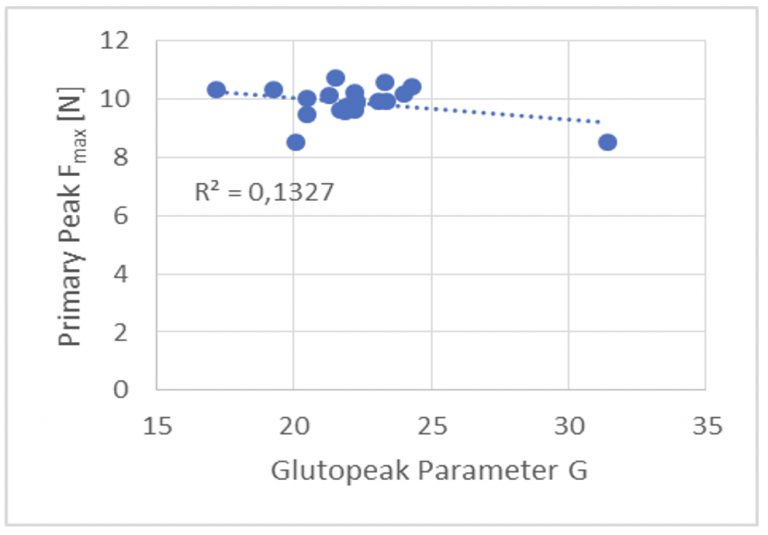
Abb. 17: Correlation of force maximum Peak 1 and GlutoPeak parameter G
However, flours with lower water absorption can also result in less stable products. This principle process is also exhibited if correlated between the designated primary peak value Fmax with the GlutoPeak parameter G (see pic. 17).
3. GlutoPeak method – modification for low-protein flours
As the test results of the Rapid Flour Check (RFC) method did not produce an optimum information, the test evaluation was carried out with the newly developed Low Protein Check Method.
By using this modified method, data about weak flours can be assessed with satisfactory accuracy in comparison with ICC methods, by using the rapid method (see pic. 18 – 20).
Contrary to the RFC method, the LPC method is verified for flours with low protein (<11%) and wet gluten content (< 25%).
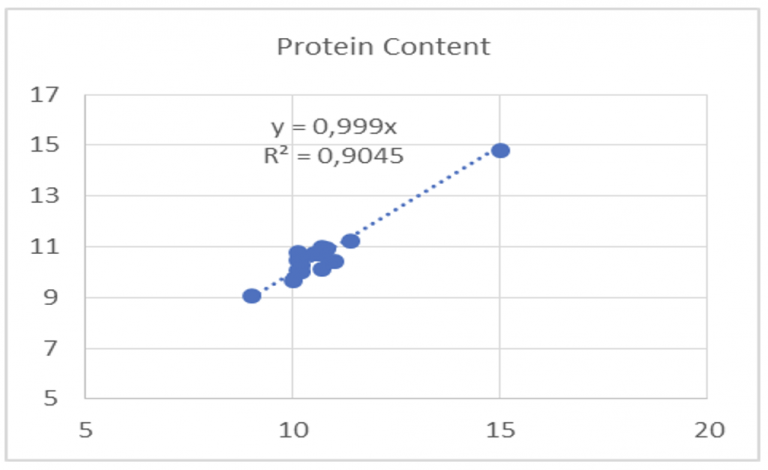
Pic. 18: Correlation of protein content measured by GlutoPeak Low Protein Check and routine analysis
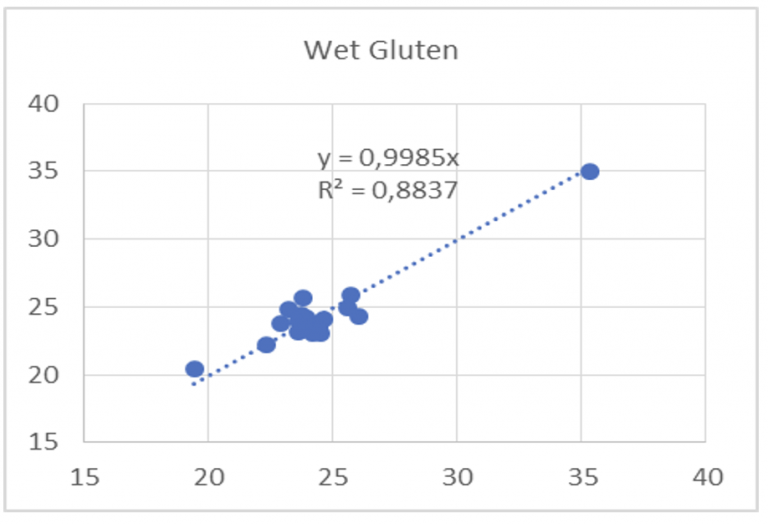
Pic. 19: Correlation of we gluten measured by GlutoPeak Low Protein Check and routine analysis
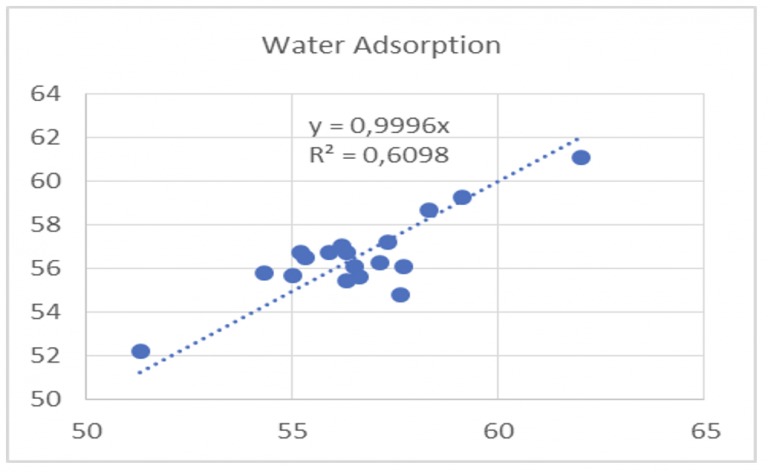
Pic. 20: Correlation of water content measured by GlutoPeak Low Protein Check and routine analysis
Thus, the correlation of dough- or baking relevant parameters obtained with the modified GlutoPeak method (see pic. 21 and 22), are nearly as reliable as the flour parameters of ICC methods.
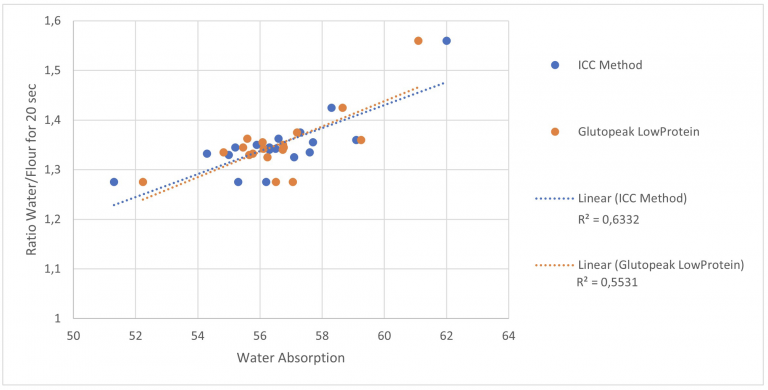
Pic. 21: Comparison of ICC- and Low Protein GP-Method relating to the water demand prognosis
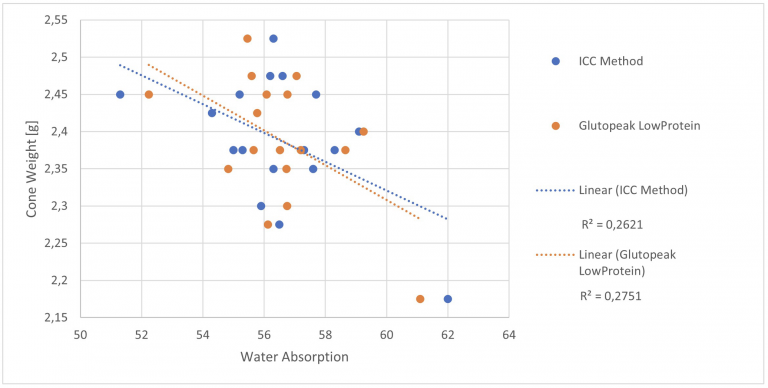
Pic. 22: Comparison of ICC and Low Protein GP-Method relating to the product weight prognosis
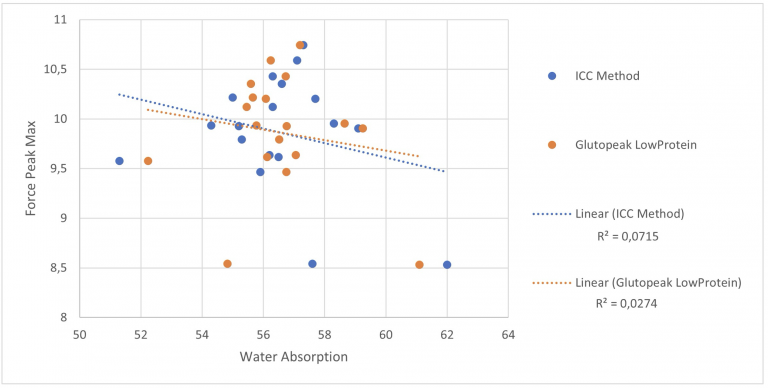
The basic predictions in regards to product properties (e.g., stability) will lead to similar conclusions (see pic. 23), as this is already possible with data obtained relating to ICC-Methods. This leads to the conclusion that the GlutoPeak Low-Protein method is a valuable alternative to the ICC-Methods.
As previously mentioned, the prediction of product properties, in regard to weight or, even more evident, the mechanical properties obtained only from flour data is rather inconsistent. These properties are not only defined by the water absorption of the flour used, but by far more other values.
Pic. 23: Comparison between ICC- and Low Protein GP Method for predicting the product stability
During the GlutoPeak tests there were two flour samples that showed the phenomenon, where no peak developed. The necessary aggregation of gluten forming proteins obviously did not take place, and lead to the fact that no relevant change in torque is measured (see pic. 24-25). This test series was carried out as triple tests in order to rule out any application mistakes. Due to the curve progression and the resulting missing values, it was not possible to include these flours in the evaluation.
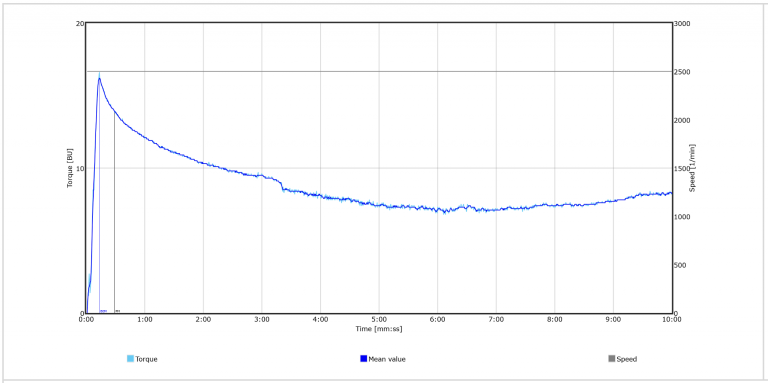
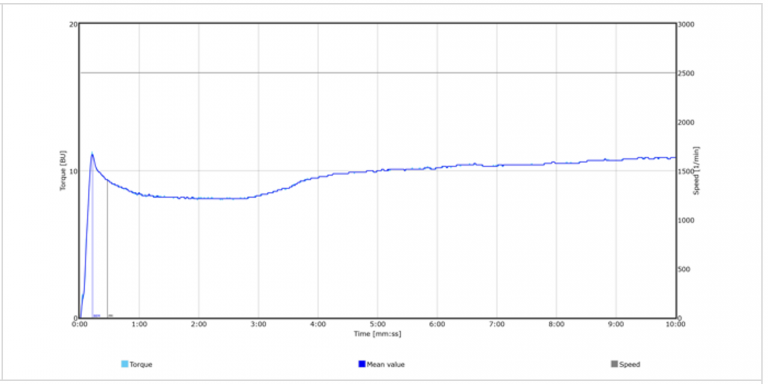
Pic. 24/25: Flour samples, which did not show a peak tested with the Low Protein GlutoPeak method
4. Conclusion
Every prediction could be reproduced, in principle. This is valid for the standard laboratory analysis, as well as for the results obtained with the GlutoPeak measurements. However, the results of the Rapid Flour Check method showed only a good correlation to a certain degree with the ICC laboratory data. Especially the water absorption – a crucial factor for characterization of waffle flours – was insufficiently displayed.
From 20 tested flours, 19 samples were defined as suitable raw material for waffle production. Only one flour sample was outside the specification shown in Tab. 1. The selected random sample is considered as homogenous.
Predicting quality trends of baked waffles, aside from analyzing the flour analysis, is very difficult, as a number of further influencing factors affect the product properties.
This is particularly valid when not only the raw material flour but also the baking parameter have a significant influence on the measuring data (e.g. texture of waffle cones). Laboratory data of the baking results correlated better when acquired via ICC-Methods in comparison to the RFC-GlutoPeak evaluation statistics-wise. This is due as the RFC-Method was developed rather than for gluten strong flours.
Because of that, the flours were also tested and evaluated with the newly developed Low Protein Check method, although at the beginning of the project, this method was not yet available. The corresponding optimized LPC-GlutoPeak method was modified by including the evaluation algorithm towards the ICC-standard methods and adapting the necessary parameters. Therefore, equivalent results were generated in comparison with the ICC-laboratory data.
With the exception of these two flours, which did not show any peak when applying the LPC method and therefore showing no results, the tests carried out with the GlutoPeak are suitable to describe the flour quality. Due to its flexibility, easy handling, small sample quantities, and short measuring times, a quick characterization of waffle flours is provided. The stored correlations, like wet gluten content, showed a good reference value with the obtained results, by applying the usual ICC Methods.
Based on the flour characterization provided with the LPC Method, a quick test of much smaller flour samples for its standard suitability as waffle flour is also possible, as a quick comparison of different flour batches. Furthermore, the measuring results may be used to make a quick estimation of the water needed, leading to a possible change of recipe or energy consumption. Predicting the product properties just going by flour analysis, independently from the measuring method, is not possible.


