To achieve net-zero, it is necessary to manage the complete life cycle of products by considering and calculating all emissions along the chain, both to and from the atmosphere.
Net-zero emissions are a sustainability target set by the UK Government to be achieved by 2050. Simply put, net-zero means that all the damaging gases released in the life cycle of a ‘product’ are balanced by those removed from the atmosphere. A product can be a physical object such as a loaf of bread or a service, like Internet banking. They each contribute emissions in their life cycle and ideally also lock away carbon.
Life cycle assessment
When assessing environmental impact, it is essential calculations cover the complete life cycle of the product, process, or activity; from raw materials acquisition through production, use and disposal. This is done using Life Cycle Assessment (LCA) software in which the effect of an activity is assessed on resource use, human health and ecological consequences. Many LCA impact factors are used to quantify these effects and commercial software differs in the emphasis it places on each. Some of the relevant categories to food manufacturing are given in Table 1.
Table 1: Examples of LCA impact factors
Impact category | Description |
Global warming potential (GWP) | Emissions of gases that warm the atmosphere, calculated as kg CO2 equivalents (CO2e). |
Acidification of the environment | Increased acidity through the release of gases such as nitrogen and sulfur oxides. |
Eutrophication | Increased concentration of nitrogen and phosphorous compounds in water sources, causing toxic algal blooms. |
Depletion of abiotic resources | Decrease in natural resources, both mineral and fossil. |
Water and land use | Changes in water availability and soil quality. |
Probably the best-known and well-understood LCA impact factor is global warming potential (GWP). This is used to calculate a product’s carbon footprint (CF) or its Greenhouse Gas (GHG) emissions. Input data to calculate CF is based on 100-year figures for gases relative to carbon dioxide (CO2e), which is given a relative figure of one (1.0). The GWP figures represent the ability of a gas to insulate the earth from heat loss to space, and in doing so, increase the earth’s temperature. Tables of relative values can be found in various sources, such as the Intergovernmental Panel on Climate Change (IPCC). The most common gases involved with bakery products made from wheat flour are carbon dioxide (CO2), methane (CH4) and nitrous oxide (N2O).
- CO2 is given a value of 1 and is the reference gas for CF calculations. CO2 is released in the burning of fossil fuels for transport and heating and released during the proving of yeasted bakery products, but this is small in comparison.
- CH4 has a value of 25, meaning it is 25 times more damaging than CO2. The main sources of methane are from agriculture including ruminants such as cattle and the anaerobic breakdown of plant materials in soil.
- N2O has a value of 298 and has a major influence on CF calculations. It is released from nitrogenous fertilizers as they break down in soils. Correct fertilizer application levels and timing are important to minimize excess in soils and its runoff to water courses.
Company GHG accounting
GHG emissions for a company are categorized into three groups or ‘scopes’. The most widely used international accounting tool is the GHG Protocol (2004) which classifies a company’s GHG emissions into three ‘scopes’, defined as follows:
- Scope 1 – direct emissions from owned or controlled sources. These include combustion gases from fuel used by the company and from company-owned vehicles.
- Scope 2 – indirect emissions from the generation of purchased electricity and heating fuels.
- Scope 3 – all indirect emissions (not included in scope 2) that occur in the value chain of the company, including both upstream and downstream emissions. This is the largest and most complex of the scopes to calculate. It includes all purchased goods and services, transport and distribution to and from the sites, business travel, employee commuting, waste disposal and emissions from leased and franchised assets.
Product GHG accounting
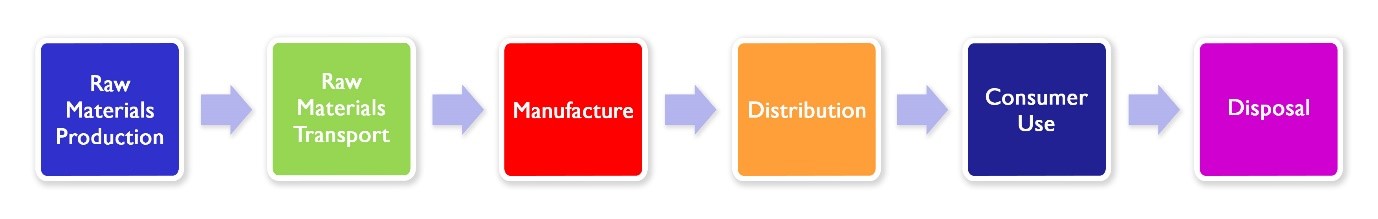
The three scopes methodology above can also be applied to products. When calculating a CF for a product, it is necessary to consider every stage in its production, from raw materials to consumer use (see Figure 1). Calculations for scopes 1 to 3 are required at each stage. Information and data to help calculate the CF of a product are available in the Publicly Available Specification 2050:2011 – Specification for the assessment of life cycle greenhouse gas emissions of goods and services published by the British Standards Institution (BSI).
Figure 1: Stages required when calculating the CF of a product
An example of a CF calculation for white bread was done as part of the specification project. Table 2 presents the stages in the product life cycle that were calculated. These show that wheat flour production, including growing and milling, contributed two-thirds of the total product CF. Data in Table 2 does not include the consumer use stage.
Table 2: GHG emissions for white sandwich bread, expressed in kg of CO2e per 800g Functional Unit (FU) (Wiltshire et al, 2008; Tucker et al, 2010).
Stage | kg CO2e/FU | % of total | Comments |
Raw materials | 0.3972 | 66.7 | Dominated by wheat emissions with N2O and CH4. Includes minor raw materials. |
Packaging | 0.0323 | 5.4 | Calculated for a single-use polythene bag. |
Transport | 0.0038 | 0.6 | Road transport of raw materials, packaging and waste. |
Processing | 0.1601 | 27.0 | Dominated by gas use during baking. |
Waste | 0.0014 | 0.2 | Scrap dough and bread goes to animal feed, some to landfill. |
Resources | 0.0003 | 0.1 | Emissions from water use are very low for bakery operations. |
Total | 0.5951 | 100.0 |
|
Raw materials production:
Wheat is the major ingredient in most bakery products, accounting for up to 80% of the finished weight in crackers, reduced to 25% in cakes. If water is excluded from the CF calculation, although it should not be because it has a small CF, the contribution from wheat flour is even higher. The crucial contribution to the CF for wheat flour is the release of excess nitrous oxide (N2O) from soil. Fertilizer additions must take place at appropriate times during the wheat-growing cycle to avoid unused fertilizer converting to gases such as N2O or leaching into water courses. This applies to both manures and to artificial fertilizers.
Most of the wheat used in the UK for bread making is grown in the UK, with Canada supplying much of the rest. UK soils are suited to wheat growing and, despite the variable weather, wheat grows well in most areas. It is interesting to note that the Chorleywood Bread Process (CBP) enabled more UK wheat to be used for UK bread production through the improved development of gluten during high shear mixing. Prior to the CBP being introduced around 1961, only 30% of UK wheat was suitable for bread making, so there was a greater reliance on imported higher quality wheat from Canada and the USA. This would have increased the GHG emissions for transporting wheat to the UK, resulting in a higher CF for bread. The current situation, with 80% UK wheat being used for UK bread making, is a more sustainable and lower CF solution.
There are various functional ingredients required for bread making at levels of 1-2% as well as several at ppm level. Their contribution to the CF will not be significant but it is necessary to estimate values based on the best knowledge of their production. Of equal significance to the CF is the impact some of these have on other LCA factors, like water and land use. Most are sourced from outside the UK, which has presented supply chain issues in recent months. One example of this is glycerol, a key ingredient in cake manufacture.
Case study – glycerol
During Spring 2022, glycerol was in short supply and remains an expensive ingredient. Glycerol is a by-product of vegetable oil processes, typically from palm oil, with about 80% coming from biodiesel production, 15% from oleochemical production and the remaining 5% from soap production. The biodiesel market is struggling because of the drive towards electrification for transport and the desire to use vegetable oils for food uses. The situation was exacerbated when Indonesia imposed a ban on palm oil exports between April 22 and May 23, 2022 to protect its domestic market. Palm oil is a major feedstock for biodiesel. The ban came at a time of immense pressure on the supply of vegetable oils into the global market because of unconnected supply issues with oils such as soy, sunflower and rapeseed. With many food oils likely to be in short supply until the 2022 harvests are available, food companies may need to reduce their requirements or find alternatives to oil-derived ingredients. Glycerol is one example of an ingredient manufactured as a by-product of food oils.
Bakery packaging materials also need to be considered when calculating a product’s CF, as does the intermediate packaging that is discarded or recycled during manufacture. Much of this is cardboard or plastics, or a combination of the two materials, as with sandwich cartons. Most plastics are made from petrochemicals that originate from crude oil. This is not a sustainable solution. Alternatives based on plant materials or recycled plastics are needed urgently.
Raw materials transport:
With many raw materials and ingredients manufactured outside of the UK, there is a cost and a CF associated with their transport. Most bakery ingredients have a long ambient shelf-life so can be transported by ship. Container shipping has a relatively low CF because of economies of scale.
The distribution of finished bakery products has a separate category for CF calculation. Most transport is by road, using diesel-fueled lorries so CF can be significant. There are examples of battery-powered lorries but their range prohibits their use currently. Few finished bakery products go overseas in shipping containers or air freight because of their short shelf-life.
Replacement of fossil fuels for transport and energy is one of the enabling strategies to achieve the UK Government’s net-zero target but this will not happen overnight. Renewable electricity capacity has more than quadrupled in the UK since 2010 and low carbon electricity now provides 50% of total generation (www.gov.uk as of 20/08/21). These are impressive figures but the drive to convert most fossil fuel processes to electrification needs to accelerate as more processes require electricity. This relies on there being sufficient nuclear, solar, wind and wave generation to provide all the UK energy needs as low carbon electricity.
Manufacture:
Bakery products tend to have a lower CF than many food products. This is because they generally do not include high CF meat and do not require refrigerated or frozen storage. As detailed above, wheat flour production contributes around two-thirds of the CF for bread, with the processing stages accounting for 27% for white sandwich bread.
Baking is the main GHG generator in processing. Data generated for the Industrial Energy Efficiency Accelerator (IEEA) report (Carbon Trust, 2014), estimated the UK industrial bakery sector consumed some 2,000 GWh, equating to emissions of approximately 570,000 tonnes of CO2 (tCO2) per year. The vast majority of this was from bakery ovens.
The baking industry is one of the food processing industries that remains heavily reliant on natural gas. Most process operations within bakeries already use electricity for power but the ovens are where change is needed. GHG emissions reduction will happen through incremental energy saving improvements in oven technology, and by movement to electrical industrial bakery ovens and greater use of hydrogen within natural gas.
Craft bakery ovens are predominantly electric. However, according to the Federation of Bakers, craft bakeries only produce around 3% of UK bread. Medium sized bakeries, such as retailer in-store bakeries (ISBs), produce around 17% of UK bread, although some of this is produced within large bakeries for reheating prior to sale. Most ISB ovens are now electric. The area where change is required is the high-speed travelling ovens that are gas-fired. Electrical versions are now available from several suppliers and are certain to become more popular as the move to cut carbon increases in pace. They contain radiant and convective heating components and bake bread to the same quality as their gas-fired counterparts. Apart from the yeast-generated CO2 released from bread dough during baking, the emissions from an electric oven are zero, assuming the electricity generation is from renewables or nuclear.
Another low carbon alternative to electricity is hydrogen, bled initially into the natural gas network at 20% and ultimately at 100%. A 20% hydrogen blend should allow existing bakery ovens to be used and avoid the huge expense of replacing a natural gas oven with electric. Hydrogen is a clean fuel that combusts to produce only water vapour. It can be used for transport, power generation, industrial applications and heating. Electrical generation of hydrogen from water will be the ultimate low carbon fuel that allows combustion processes like engines and burners to be used.
The move from natural gas to a fuel blend containing 20% hydrogen is currently being investigated. There could be implications for the performance of bakery ovens, therefore this change requires thorough testing. Experimental trials are ongoing with Campden BRI to measure the effects on oven performance and product quality from burning 20% hydrogen in natural gas. Products of interest are bread, cake and biscuits. This work is part of a UK-wide project to investigate sectors where natural gas use is high and electrification could be difficult.
Consumer use:
Most bakery products do not require refrigeration or cooking, reducing the impact on the product CF. Probably the major contribution to the CF is the way the consumer disposes of the waste product, including the packaging. This has attracted a lot of interest recently.
Data presented in Table 2 was generated for the industrial production of food products such as bread. The impact on the CF from consumer use stages is separate. The most significant aspect within consumer use is the management of waste.
Disposal:
Reduction in bread waste at all stages in its life cycle is one of the most impactful strategies to improve the sustainability credentials of bread manufacturing. This involves reducing, reusing and recycling bread (and its packaging materials), so less bread is manufactured in the first place, reducing wheat requirements and environmental impact. Bread waste is well-publicized. Around 900,000 tonnes of bread are thrown away each year, much of which is avoidable. The proportion of wheat in bread is around 50% by weight, so the potential exists to reduce wheat grown in the UK by up to 450,000 tonnes each year by minimizing bread waste. CF savings are made at all production stages but the high agricultural and baking impacts make waste reduction vitally important.
Bakery packaging tends to use both paper and plastic. Recycling, reusing or disposing of these materials is complex. The food packaging industry is working to find the best solution. Calculations on just one of the LCA impact factors can be misleading and suggest a solution is not required. For example, GHG emission data is based on gases released into the atmosphere over a timescale of 100 years. Plastics remain in solid form for at least 100 years and therefore do not contribute to GHG emissions during the disposal stages. The CF from disposal of a plastic food package will be zero. This is where other LCA impact factors must be considered so that a true picture of the environmental impact of plastics can be assessed. It is well documented that plastic packaging needs to be reduced because of the damage it causes to the environment. Factors like ‘depletion of abiotic resources’ and ‘water and land use’ should be used to generate the true LCA assessment.
Summary
The baking industry does not differ from any other in that it faces several sustainability challenges. This article has outlined some of these and highlighted strategies to improve the situation. Global financial constraints are inhibiting the funding required to advance the solutions to the point they are readily available and economic. Consumer pressure and a desire for companies to ‘do the right thing’, are going to help move this on fast. Materials and fossil fuels will have no option but to find alternatives within a timescale of a few decades. Some issues such as plastic waste building up in the environment cannot wait this long. Solutions are needed within the next 5-10 years.
References
Defra (2010). Trialling the PAS 2050. www.scienceresearch.defra.gov.uk
Goucher, L., Bruce, R., Cameron, D., Lenny Koh, S.C. and Horton, P. (2017). The environmental impact of fertilizer embodied in a wheat-to-bread supply chain. Nature Plants 3, article number 17012.
Wiltshire, J., Tucker, G. and Fendler, A. (2008). Carbon footprint of British food production. www.researchgate.net/publication/296165915.
Tucker, G., Foster, C., Wiltshire, J. (2010). Life cycle analysis and carbon footprinting with respect to sustainability in the agri-food sector. CAB Direct. www.cabdirect.org/cabdirect/abstract/20103223638
Carbon Trust (2014). Improving the efficiency of bakery ovens. https://c2e2.unepdtu.org/wp-content/uploads/sites/3/2016/03/cts402-improving-efficiency-of-bakery-ovens-0.pdf
The Greenhous Gas Protocol (2004). https://ghgprotocol.org/sites/default/files/standards/ghg-protocol-revised.pdf
PAS 2050:2011 – Specification for the assessment of life cycle greenhouse gas emissions of goods and services, BSI
By Gary Tucker, Fellow, Campden BRI
Photo: Pexels
This article was published in Baking+Biscuit International, issue 4 – 2022